MatplotlibChart
Displays Matplotlib chart.
Examples
Bar color chart
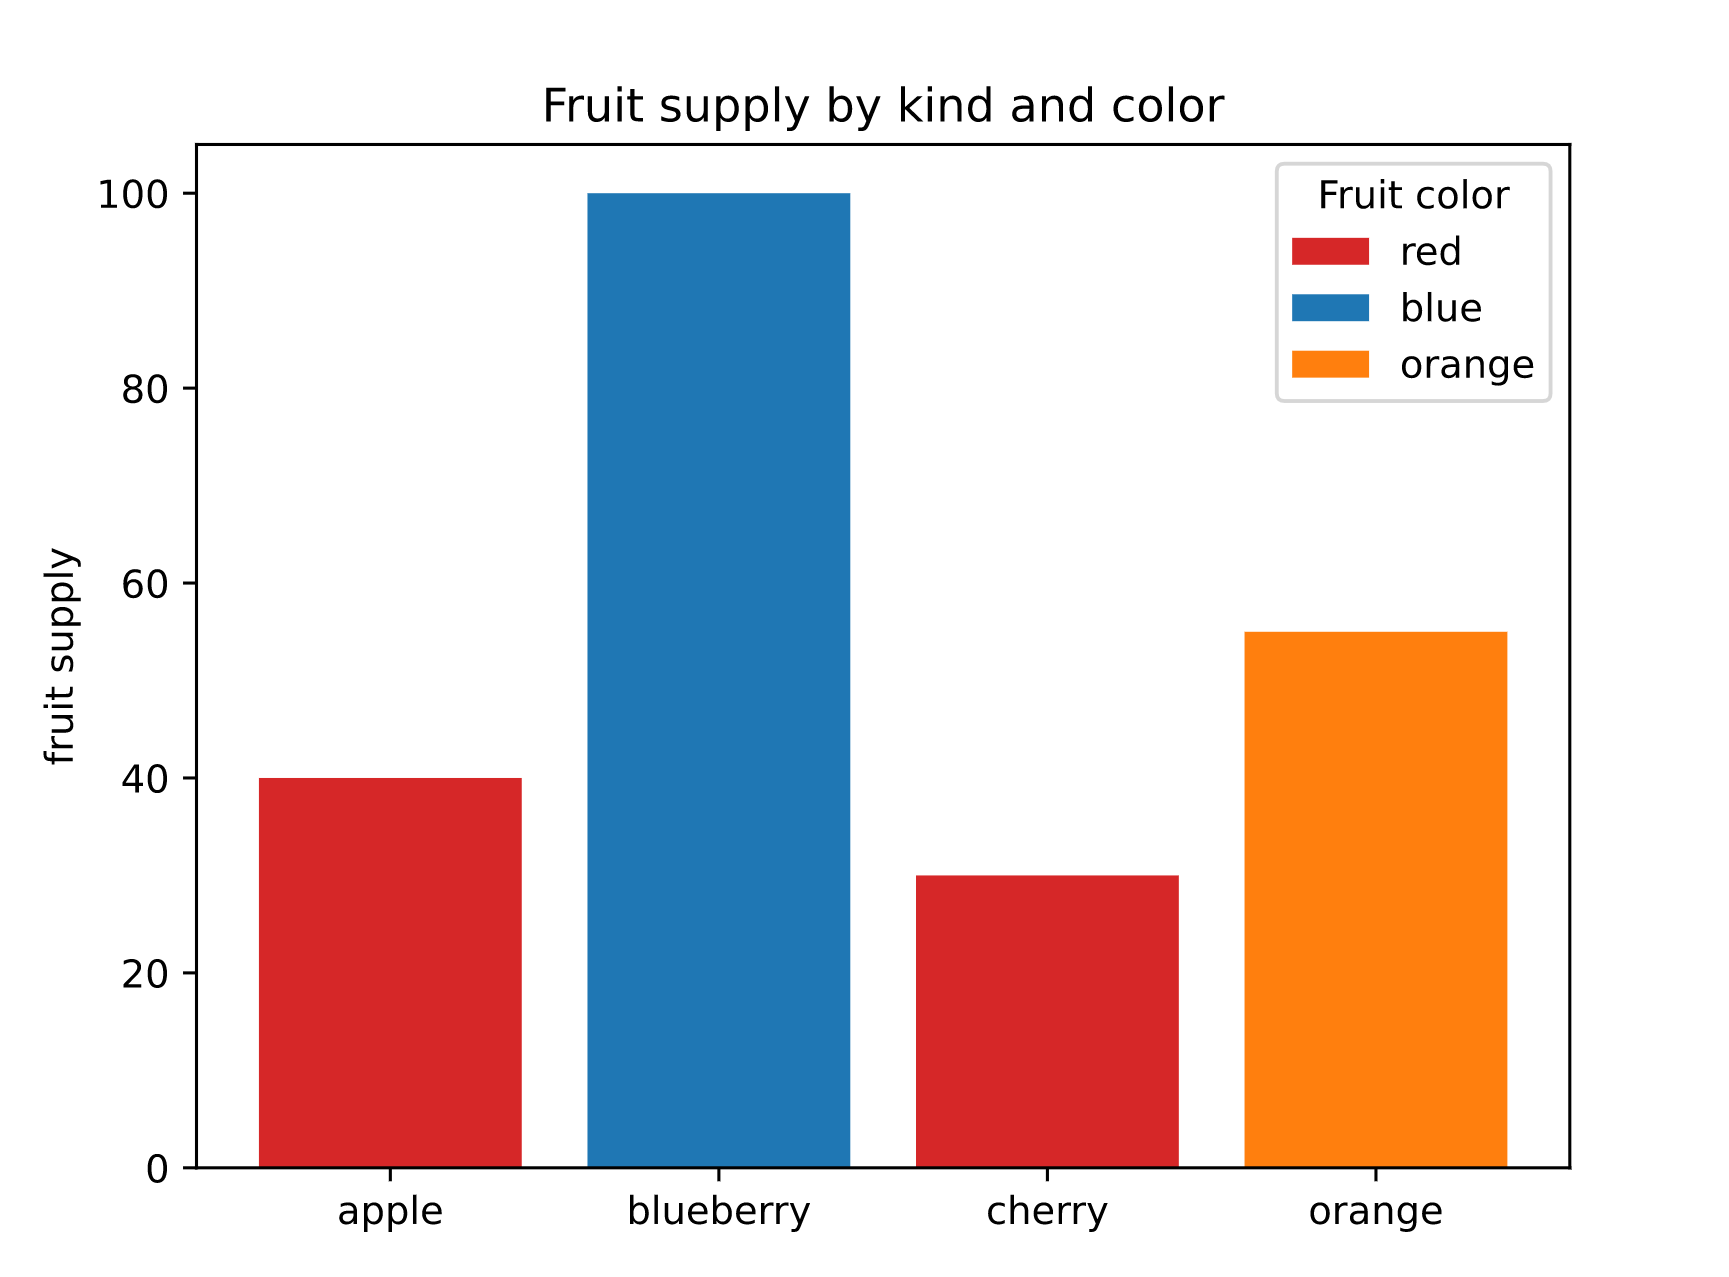
The following example is based on original example from Matplotlib docs.
import matplotlib
import matplotlib.pyplot as plt

import flet as ft
from flet.matplotlib_chart import MatplotlibChart

matplotlib.use("svg")


def main(page: ft.Page):

    fig, ax = plt.subplots()

    fruits = ["apple", "blueberry", "cherry", "orange"]
    counts = [40, 100, 30, 55]
    bar_labels = ["red", "blue", "_red", "orange"]
    bar_colors = ["tab:red", "tab:blue", "tab:red", "tab:orange"]

    ax.bar(fruits, counts, label=bar_labels, color=bar_colors)

    ax.set_ylabel("fruit supply")
    ax.set_title("Fruit supply by kind and color")
    ax.legend(title="Fruit color")

    page.add(MatplotlibChart(fig, expand=True))


ft.app(target=main)
Line chart
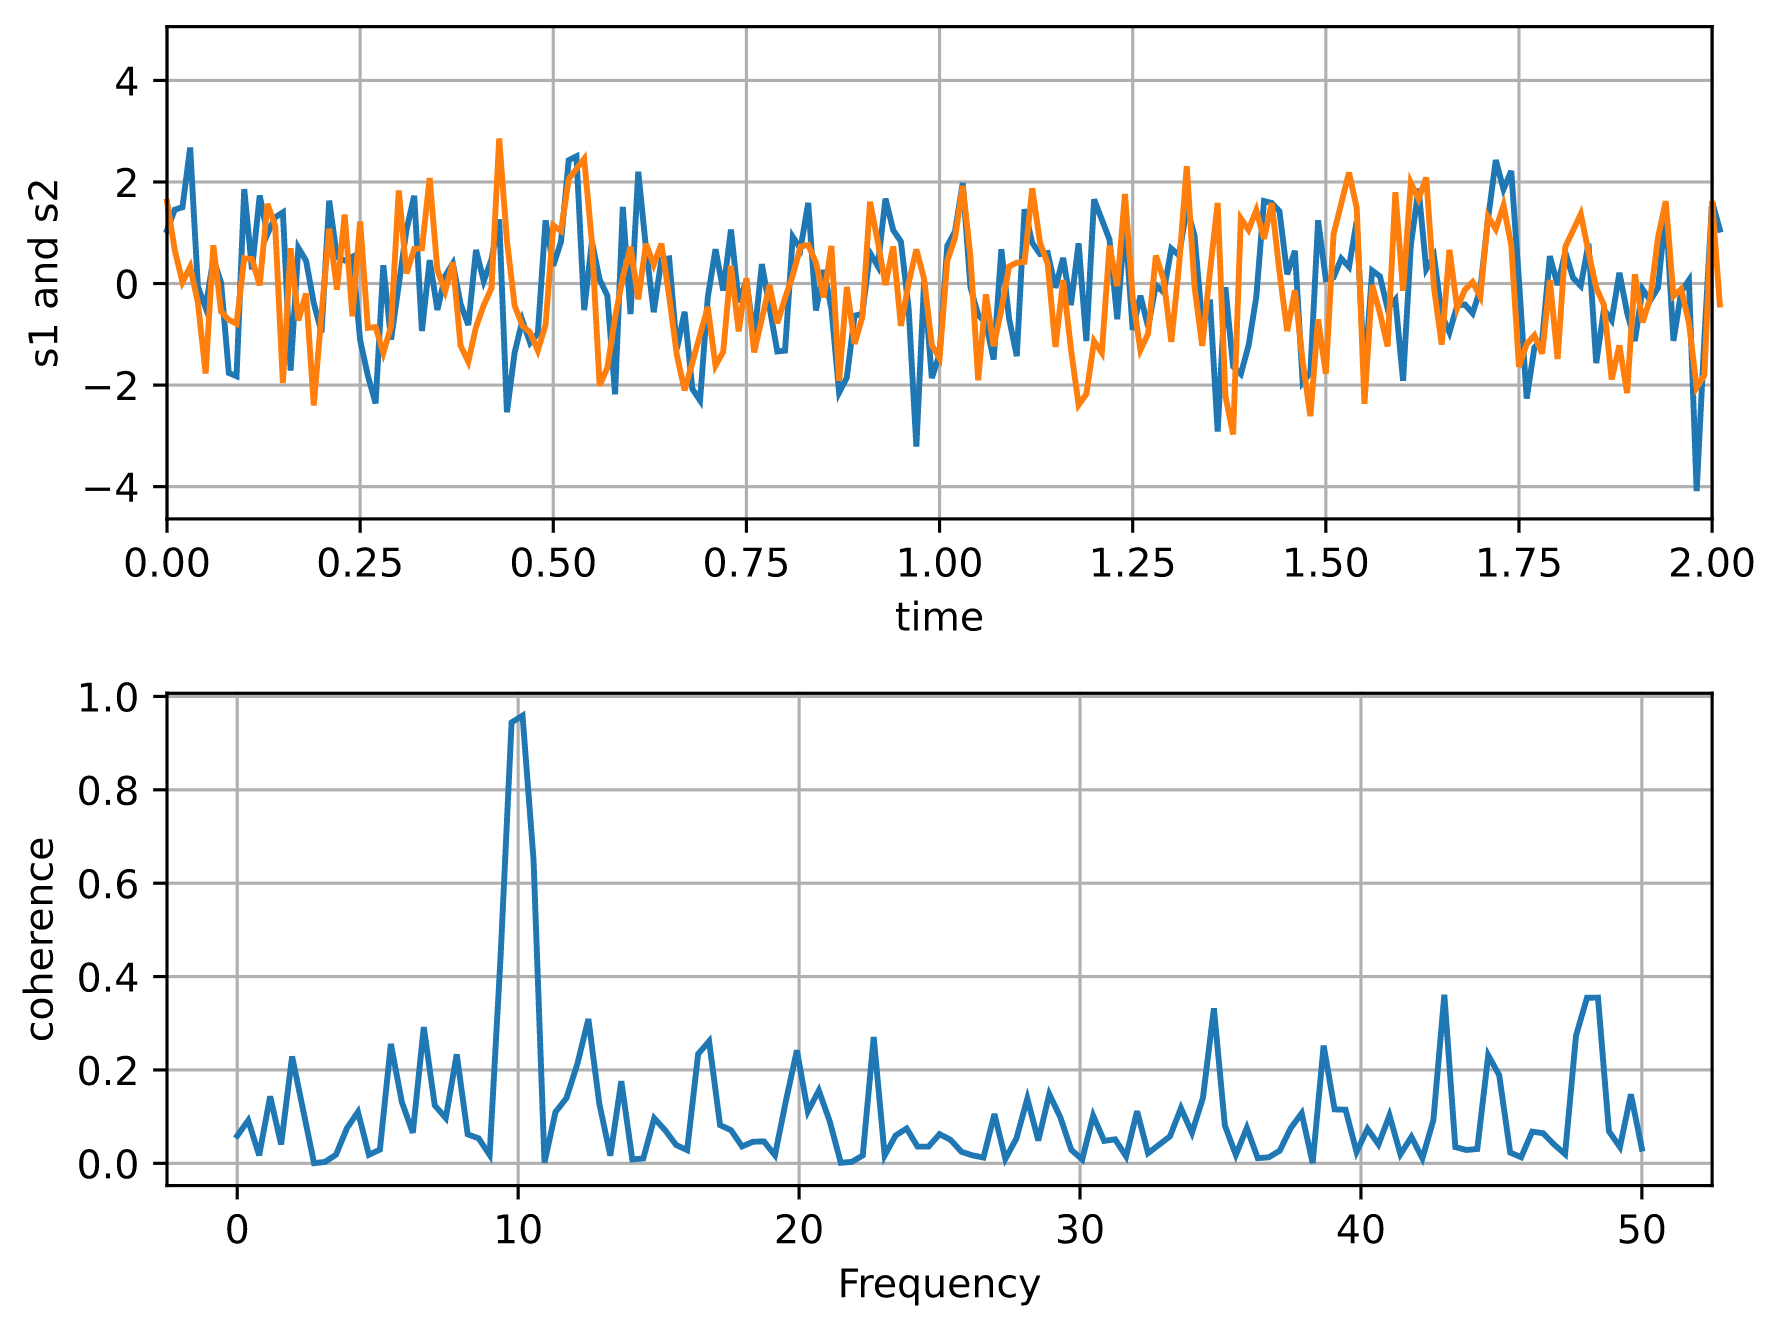
The following example is based on original example from Matplotlib docs.
import matplotlib
import matplotlib.pyplot as plt
import numpy as np

import flet as ft
from flet.matplotlib_chart import MatplotlibChart

matplotlib.use("svg")

def main(page: ft.Page):

    # Fixing random state for reproducibility
    np.random.seed(19680801)

    dt = 0.01
    t = np.arange(0, 30, dt)
    nse1 = np.random.randn(len(t))  # white noise 1
    nse2 = np.random.randn(len(t))  # white noise 2

    # Two signals with a coherent part at 10Hz and a random part
    s1 = np.sin(2 * np.pi * 10 * t) + nse1
    s2 = np.sin(2 * np.pi * 10 * t) + nse2

    fig, axs = plt.subplots(2, 1)
    axs[0].plot(t, s1, t, s2)
    axs[0].set_xlim(0, 2)
    axs[0].set_xlabel("time")
    axs[0].set_ylabel("s1 and s2")
    axs[0].grid(True)

    cxy, f = axs[1].cohere(s1, s2, 256, 1.0 / dt)
    axs[1].set_ylabel("coherence")

    fig.tight_layout()

    page.add(MatplotlibChart(fig, expand=True))

ft.app(target=main)
Properties
figure
Matplotlib figure to draw - an instance of matplotlib.figure.Figure class.
isolated
Every time when a page or parent chart control are updated with page.update() or Control.update() methods respectively the chart is re-drawn by calling Matplotlib API. Frequent re-drawings of large charts could affect the performance of the entire Flet app.
Set isolated to True to enable explicit chart updates. To re-draw the chart call its update() method. For example the first example on this page could be modified as following:
def main(page: ft.Page):

    # ...

    # set initial axis legent
    ax.legend(title="Fruit color")

    # enable explicit updates
    # and add chart to a page
    chart1 = MatplotlibChart(fig, isolated=True, expand=True)
    page.add(chart1)

    sleep(5)

    # update chart axis
    ax.legend(title="Colors")
    chart1.update()

ft.app(target=main)
original_size
Whether to display chart in original size.
Defaults to False - display a chart that fits configured bounds.
transparent
Whether to remove the background from the chart.
Defaults to False - display a chart with background.